


What Claude Dashboards is
Anthropic released Claude Dashboards in beta on October 8, 2026, alongside Claude Motion.
You connect a data platform such as Amazon Redshift, BigQuery, ClickHouse, Databricks, or Snowflake, or another connected app such as Salesforce, and ask a question in plain language. Claude writes an SQL query for each chart, runs it against your data source, and builds the dashboard.
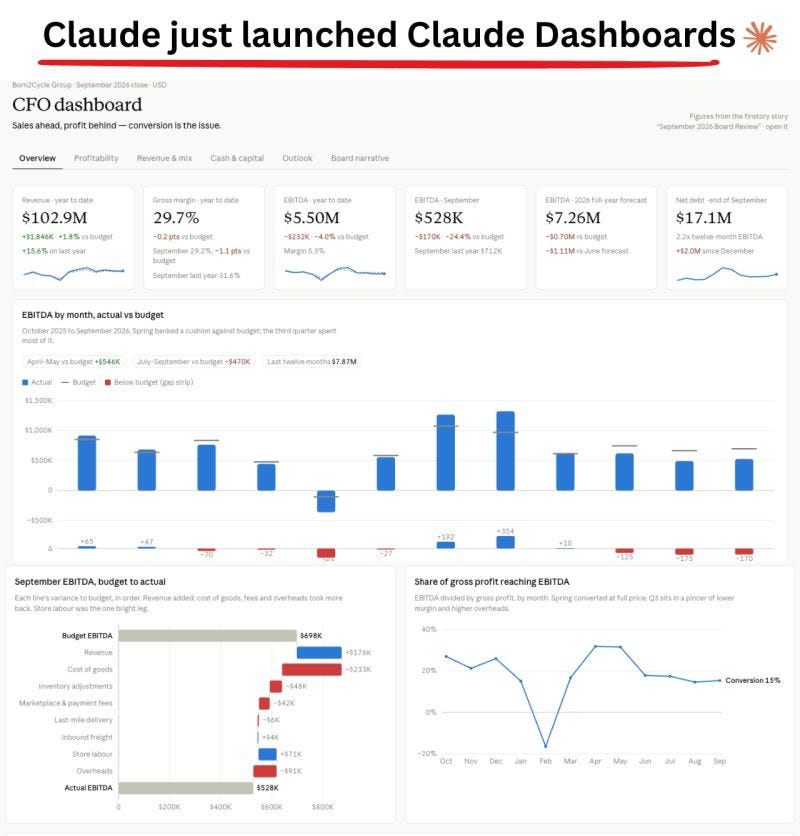
For finance teams, the key detail is that every chart shows the query behind it and when its data was last refreshed. Anthropic positions it for quick, exploratory questions and says it does not replace your BI tools; for deeper analysis, you send the dashboard on to tools such as Sigma, Omni, or Grafana.
It is in beta on Pro, Max, Team, and Enterprise plans.
On Enterprise it is off until an owner turns it on in Organization settings > Artifacts, and dashboards start private until shared.
Read on.
I built a finance control tower from one prompt
I used Google’s public e-commerce dataset in BigQuery, thelook_ecommerce, which holds more than 3.3 million synthetic records covering orders, products, inventory, customers, and returns.
With one prompt, asking Claude to act as the CFO of this business, I got this dashboard below.
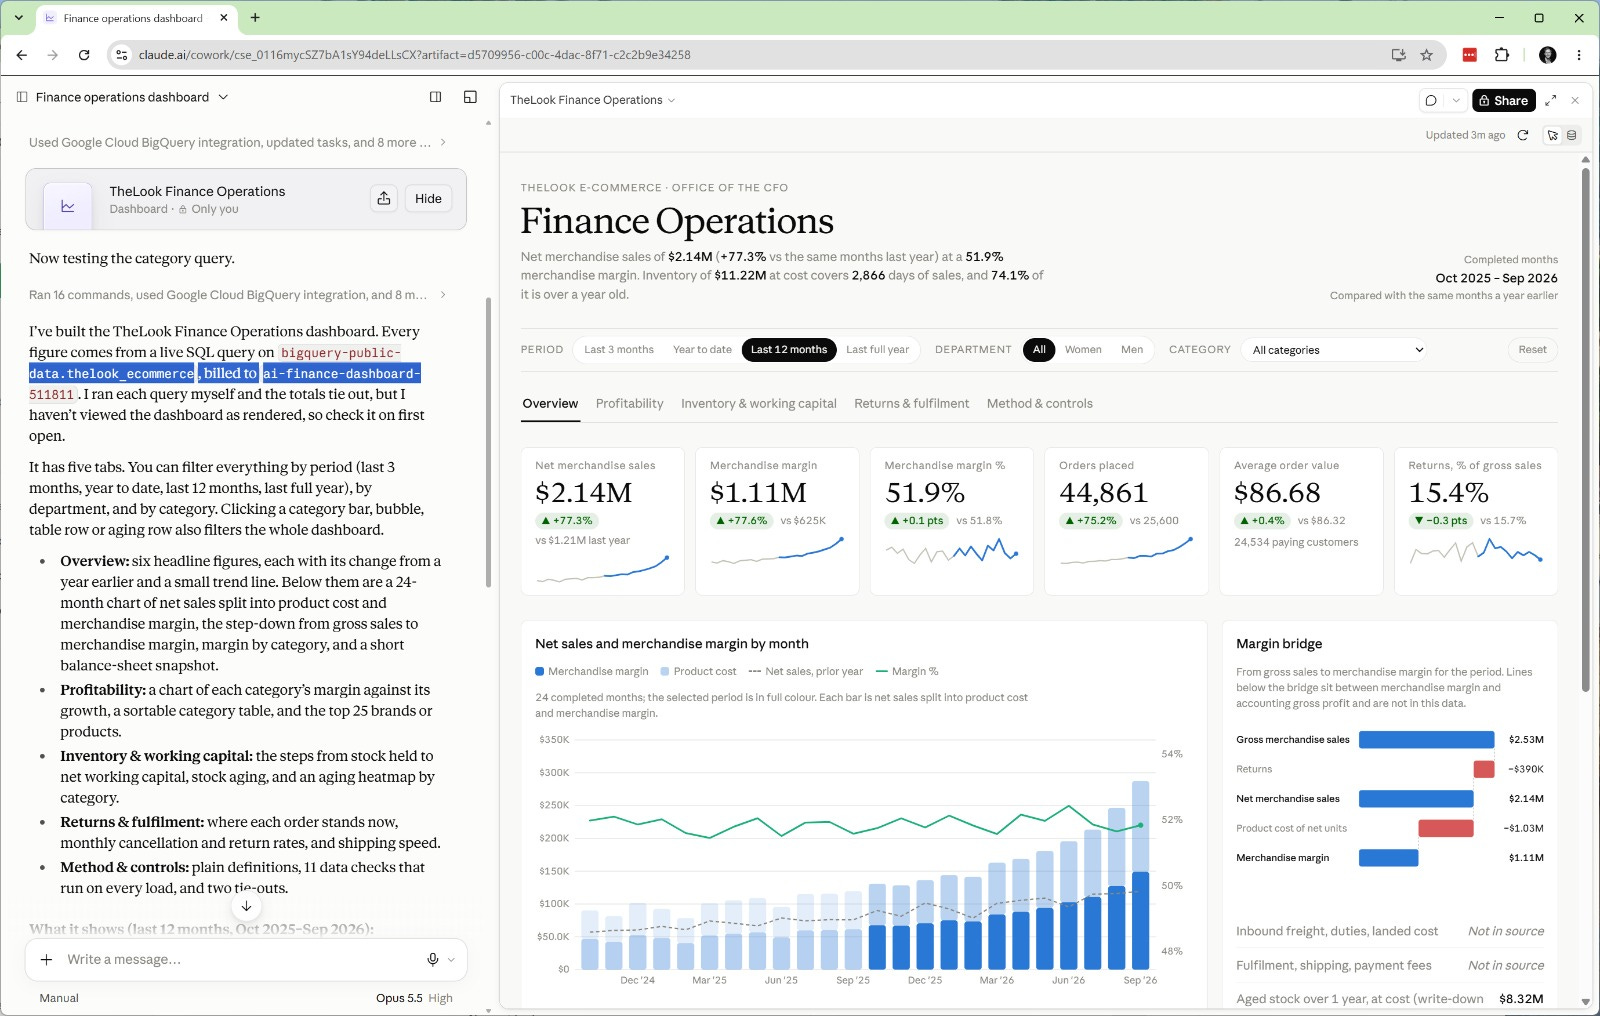
The TheLook Finance Operations dashboard built from Prompt 1
At first glance, the business looked great.
Over the last 12 months, net merchandise sales were $2.14M, up 77.3%, with a merchandise margin of $1.11M at 51.9% on 44,861 orders. Claude built five tabs with filters by period, department, and category, and it added a Method & Controls tab that runs 11 data checks every time the dashboard loads.
Then I noticed how much inventory sat on the same page, and the growth story started to feel too easy.
Push Claude to find where the cash is stuck
So I asked the question I would ask any finance team after a year like that: sales are growing, but is the business actually getting healthier?
I half expected Claude to cheer the 77%. Instead, its answer started with one word:
“Partly. Turnover is improving because the cost of goods sold grew faster than stock. But most of the stock isn’t moving, and that looks more like a problem with the stock records than a buying problem.”
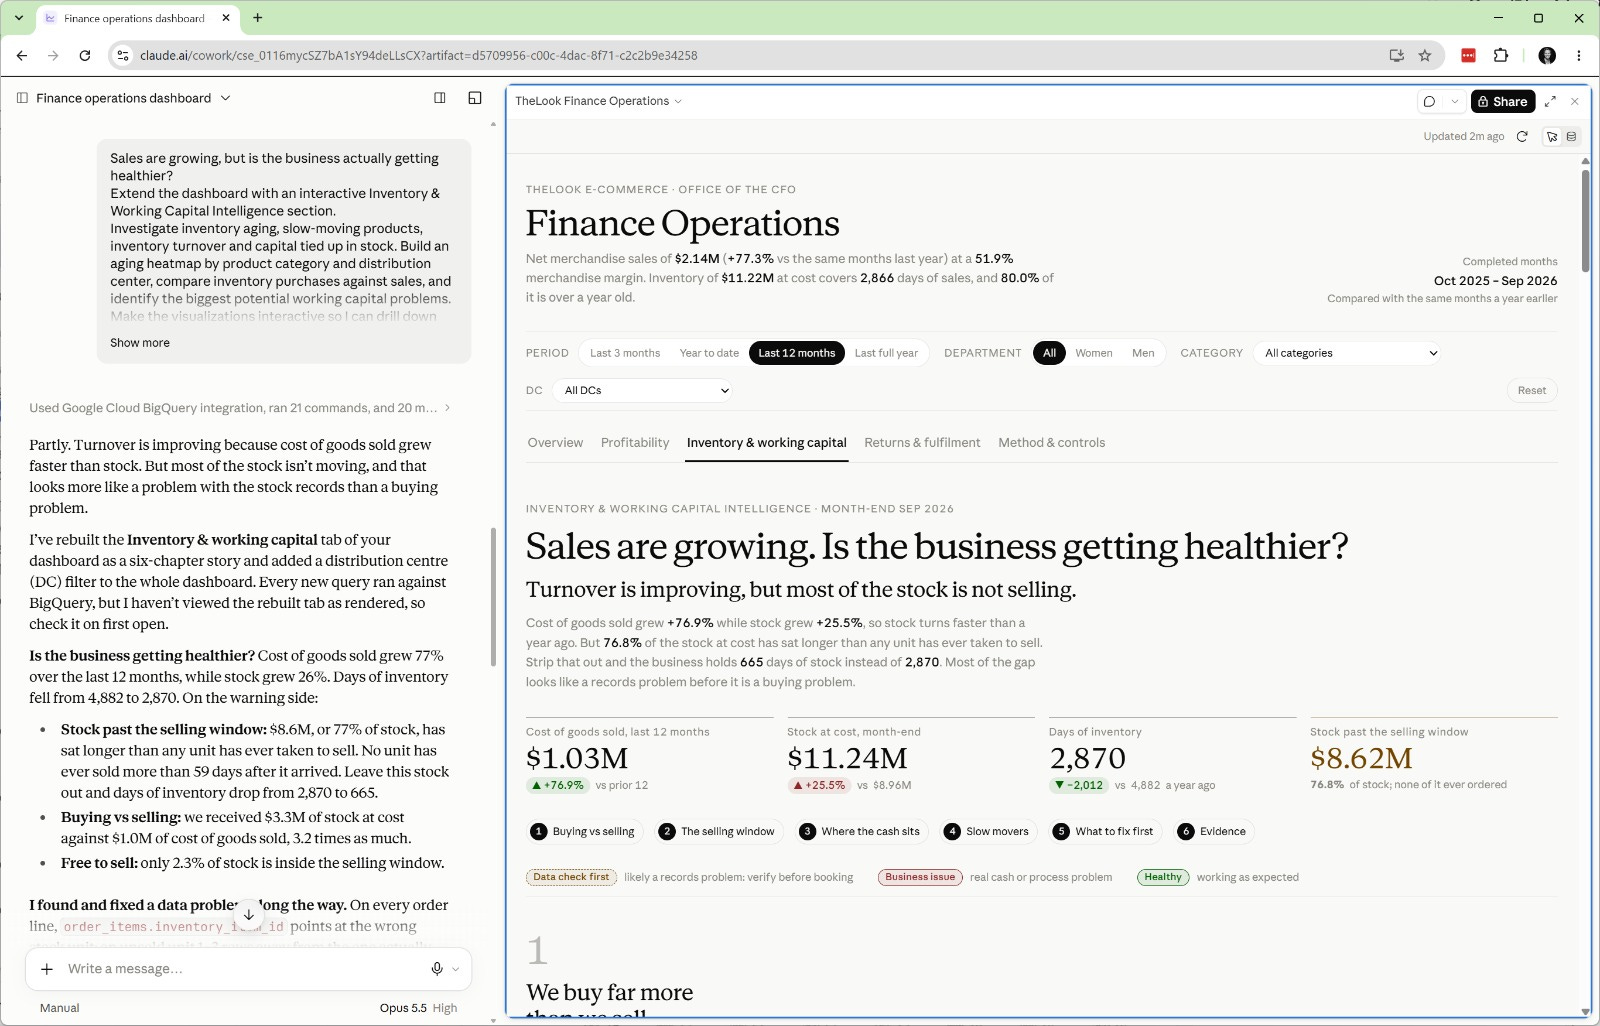
The rebuilt Inventory & working capital tab after Prompt 2
What surprised me most was what Claude did next. It didn’t hand me an $8.62M write-down. It tagged the finding “Data check first,” which means it believes this is more likely a records problem than a real loss and that it should be verified before anything gets booked.
This is exactly what I would want from a good analyst, and it was the moment I started seeing this as a tool a controller can actually use.
Below, I walk you through exactly how I built it, with both prompts word for word.
Build the Finance Operations dashboard in 10 minutes
Connect Claude to your data and COPY/PASTE PROMPTS